What’s Really Driving the Gold and Silver Boom
This precious metals rally feels familiar.

Is the precious metals market trying to tell us something?
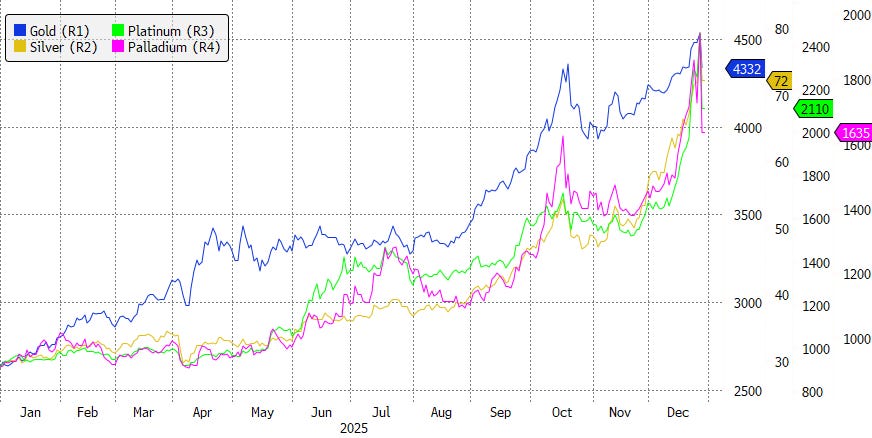
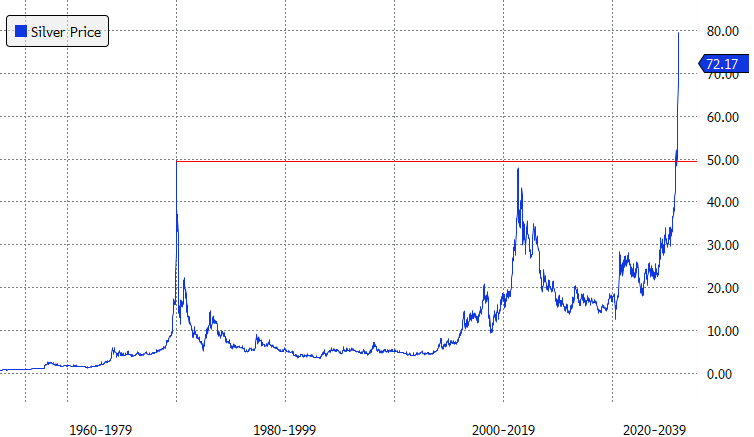
Gold just hit an all-time high above $4,500 an ounce. Silver surged to more than $80 for the first time ever. Platinum is at a record too.
Social media is buzzing with theories trying to make sense of the move. I have a view of my own. But first, a quick walk down memory lane.
Echoes Of 2011
I started working as an analyst in early 2011 at a now-defunct commodities investing site called Hard Assets Investor. It was a good time to be in that business. Commodities were one of the hottest corners of the market, and investor interest was intense.
But 2011 wasn’t really the start of the story. It was closer to the end.
Commodities had already peaked in 2008 on the back of the China and emerging-markets boom. They collapsed during the financial crisis and then rebounded sharply. By 2011, prices for oil, copper, corn, and a long list of other raw materials were back near their pre-crisis highs.
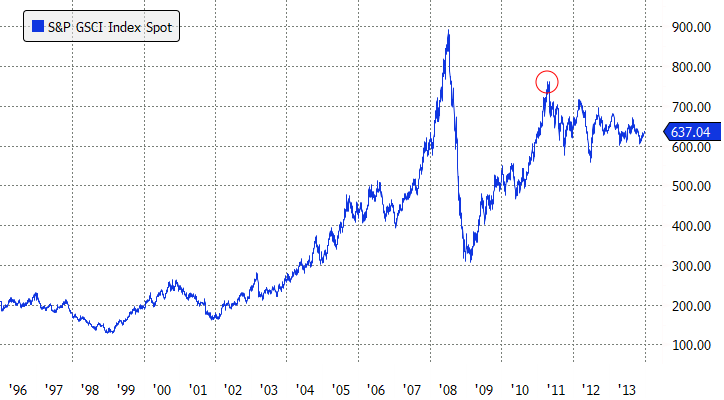
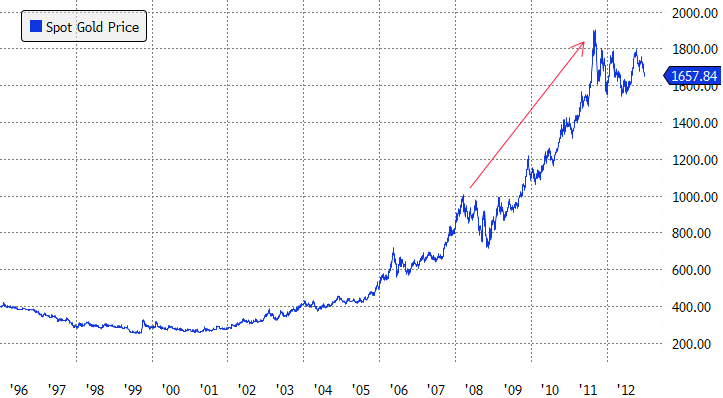
One group of commodities, though, went well beyond its 2008 peak: precious metals.
Gold didn’t just recover from the financial crisis. It surged from around $1,000 in 2008 to over $1,900 an ounce by 2011.
Silver was even more extreme, climbing from roughly $20 at its 2008 high to nearly $50 three years later.
With gold and silver going vertical again, the action in precious metals today reminds me of what happened in 2011. The circumstances are different in many ways, though there are some important similarities.
What’s Different This Time
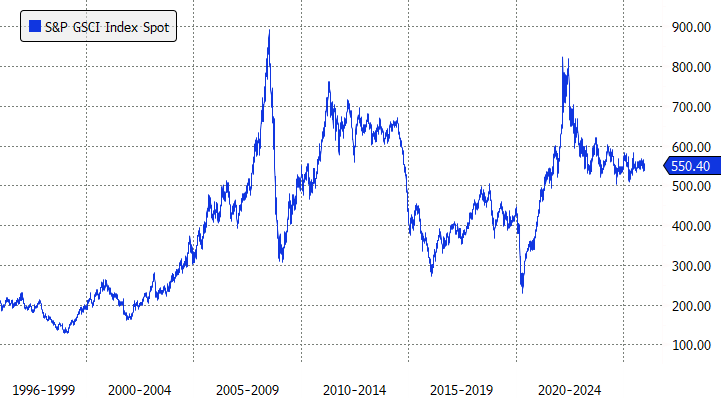
Back in 2011, the precious metals rally was unfolding alongside a broader commodities boom. That’s not what’s happening today. Most commodity markets are nowhere near record highs.
It was also easier to point to clear catalysts back then. In the aftermath of the global financial crisis, central banks around the world slashed interest rates to zero, stoking fears of inflation (ironically, deflation would end up being the bigger concern for much of the following decade).
The world felt fragile. First came the 2008 financial crisis, then the European sovereign debt crisis between 2010 and 2012. For a stretch, the global economy seemed like it was being held together with duct tape. Investors stampeded into precious metals as a hedge against an economic system that felt perpetually on the brink.
The big symbolic moment came in August 2011, when S&P downgraded the credit rating of U.S. government debt, pouring fuel on the precious metals rally. Gold peaked about a month later.
Today, there’s no single visceral crisis to point to. The stock market is closing out 2025 near record highs, and the economy, for all its flaws, is holding up reasonably well. This doesn’t feel like a panic environment.
Instead, the backdrop is defined by a collection of slower-burn concerns. Government debt continues to balloon in the U.S. and elsewhere. Geopolitical tensions simmer across multiple regions. Inflation has proven stickier than expected, even if it remains well below the highs of 2021 and 2022.
Add in questions about Federal Reserve independence, a weaker dollar, and growing unease about the long-term appeal of U.S. assets, and you have a mix of forces putting upward pressure on precious metals.
The Trade War Trigger
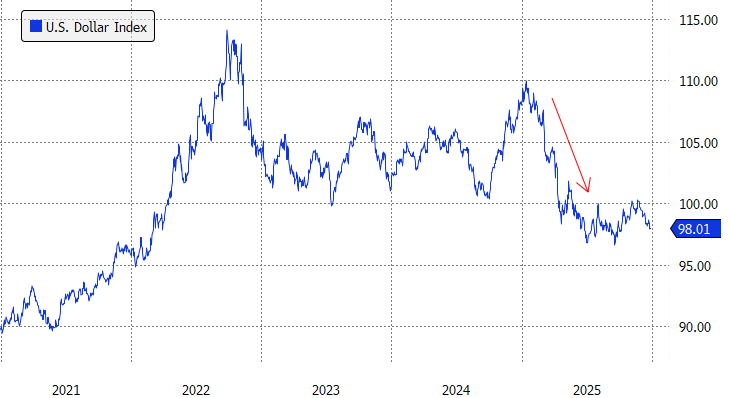
Personally, I think a major catalyst this year was the trade war and tariff escalation that unfolded early in 2025. The dollar fell sharply during that period and remains down nearly 10% on the year.
For many investors, especially outside the U.S., that episode reinforced concerns about overreliance on the dollar and U.S. Treasuries as the backbone of the global financial system. Gold, in particular, began to look more attractive as a neutral store of value sitting outside the U.S. financial system.
That wariness had been building for years, but it wasn’t a meaningful factor during the last precious metals mania in 2011.
Back then, central banks had only just become net buyers of gold after nearly two decades of steady liquidation. Today, they account for close to a quarter of total gold demand.
Countries like China, Russia, Turkey, and India have been buying aggressively, even at record prices. They’re not doing this because they necessarily expect gold to keep surging. Rather, they’re reducing reliance on the U.S. dollar by holding an asset that is far harder to freeze or sanction.
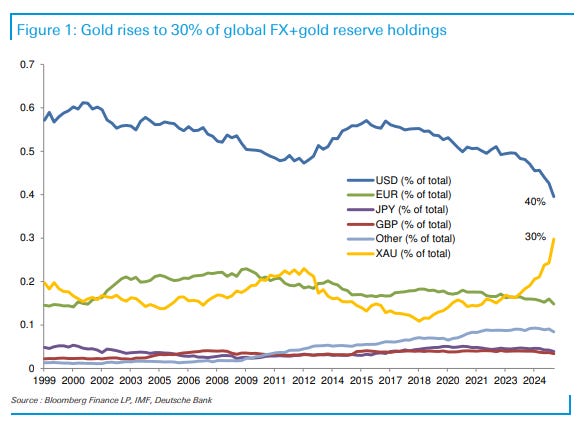
According to Deutsche Bank, gold now makes up roughly 30% of global foreign-exchange reserves, up from about 15% just a few years ago. The U.S. dollar remains the largest reserve currency at around 40%, but its share continues to shrink.
That’s a meaningful shift.
What’s The Same
While many things are different this time around, one important element looks very familiar: the outsized role investors are playing.
The launch of SPDR Gold Shares (GLD) more than two decades ago transformed the gold market by making it easy to buy gold through a brokerage account. The fund was an immediate hit, becoming the fastest ETF ever to reach $1 billion in assets, just three days after launch. That record stood for 17 years, until the ProShares Bitcoin ETF (BITO) broke it in 2021.
ETF inflows introduced a powerful new source of demand, particularly during periods of stress. During the financial crisis, investors poured money into gold ETFs at a staggering pace. In 2009 alone, gold ETFs absorbed roughly $20 billion of gold, accounting for about 18% of total global demand, according to the World Gold Council.
Demand spiked again during the eurozone debt crisis and later during the 2020 COVID pandemic, when nearly $50 billion flowed into gold ETFs globally.
This year, gold ETF demand is following a similar pattern, just on a much larger scale. Roughly $82 billion has flowed into gold ETFs globally so far, by far the largest dollar amount on record.
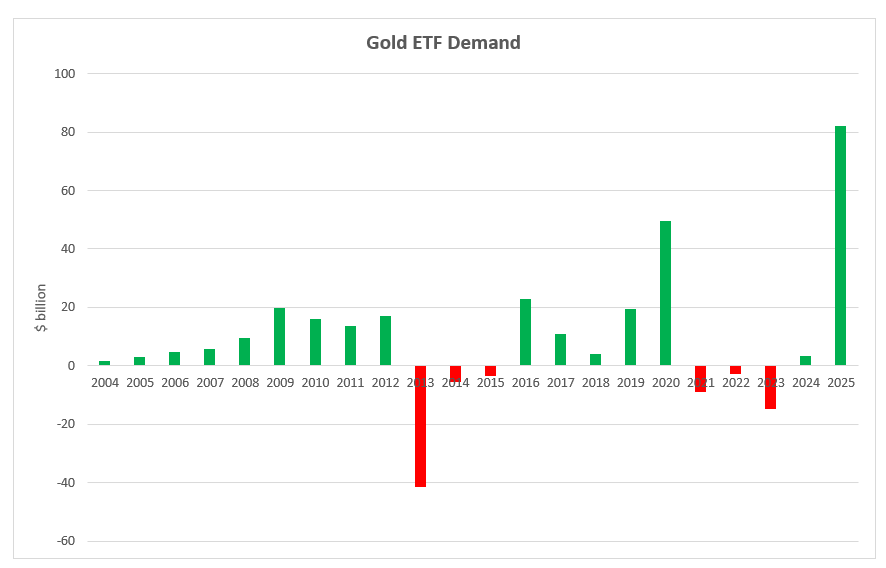
On a tonnage basis, 2020 still holds the record, with about 893 metric tons absorbed by ETFs, compared with roughly 749 metric tons this year. That gap largely reflects higher prices today, with gold now trading at double or triple its 2020 levels, meaning each dollar buys less metal.
Even so, ETF demand alone represents roughly 15% of total annual gold demand. Add in physical investment demand through bars and coins, and investment demand could account for more than 42% of total gold consumption this year, up from about 26% in 2024.
Jewelry demand, which made up roughly 44% of demand in 2024, may fall closer to one-third in 2025. In other words, investors are increasingly crowding out other sources of gold demand.
Why Silver Is Surging
While gold has driven the broader precious metals rally, silver has captured even more attention in recent weeks. There are two competing (or perhaps complementary) explanations for silver’s move.
The first is that silver is acting like “cheap gold.”
Silver has badly lagged gold for years. When gold hit a then-record high above $2,000 an ounce in 2020, silver was still roughly 40% below its 2011 peak and hadn’t set a new high since 1980.
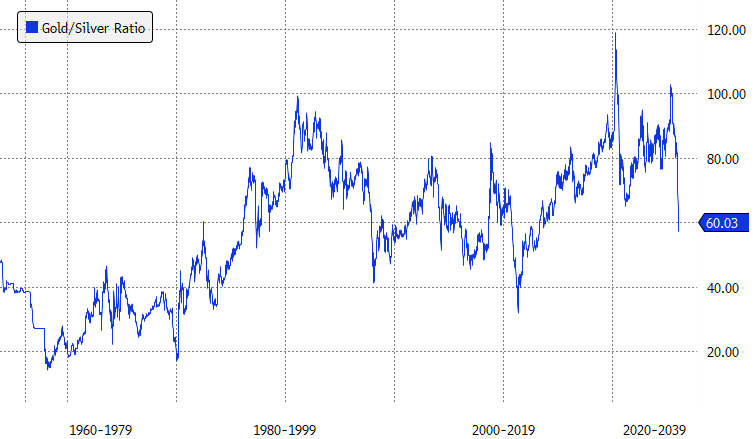
The gap became extreme. The gold-to-silver ratio, which measures how many ounces of silver it takes to buy one ounce of gold, surged to a modern-day record high of about 120.
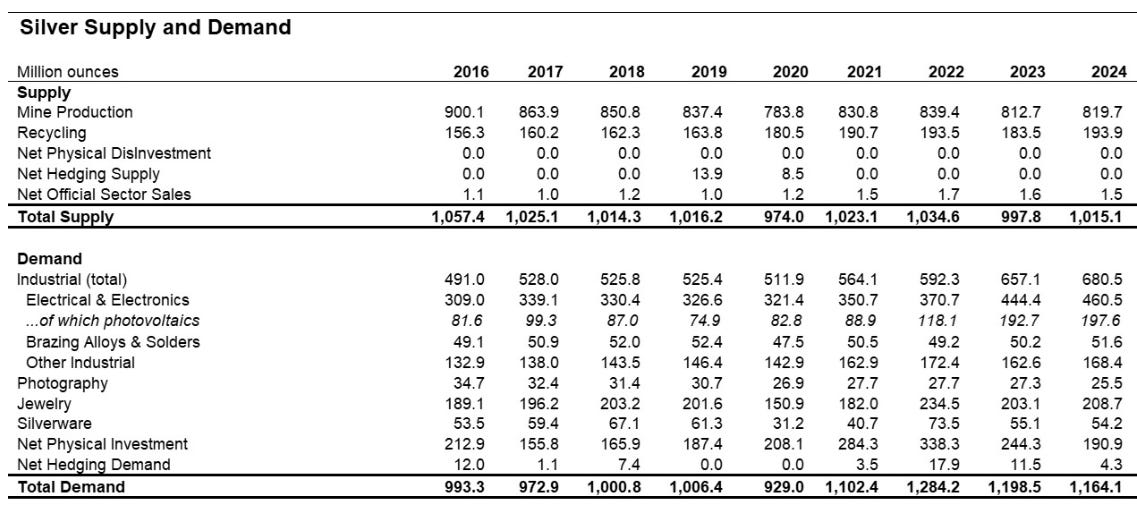
There were reasonable explanations for silver’s underperformance. Unlike gold, silver is heavily tied to the real economy. Roughly 50% to 60% of total silver demand has come from industrial uses in recent years, according to The Silver Institute, compared with a single-digit share for gold.
As gold increasingly established itself as a central bank asset and a portfolio diversifier for investors, silver was largely left behind. Its industrial nature made it more economically sensitive, and less attractive as a store of value.
That changed this year.
As gold continued to surge, silver finally found a bid. More than $10 billion has flowed into silver ETFs globally this year. Because silver is a much smaller market than gold, those inflows have had an outsized impact on prices.
Silver’s supply-and-demand dynamics amplify that effect. A large portion of demand is industrial, and much of it cannot be switched off in the short term. When investment demand for gold spikes, higher prices can eventually draw out sellers. Jewelry purchases can be deferred, and central banks can slow or pause buying.
That’s less true for silver.
The Silver Growth Story
That brings us to the other narrative circulating to explain silver’s surge. This view holds that silver isn’t just playing catch-up with gold, but has its own growth story tied to rising industrial demand.
Unlike gold, silver plays a critical role in modern technology. It is prized for three core properties: the highest electrical conductivity of any metal, excellent thermal conductivity, and strong resistance to corrosion. Those characteristics make silver valuable in applications where efficiency, heat management, and durability matter.
One of the largest sources of industrial demand for silver is the solar industry, where silver is used in photovoltaic cells to conduct and collect electricity generated from sunlight.
Solar demand for silver has grown rapidly. Photovoltaic consumption more than doubled from roughly 89 million ounces in 2021 to about 198 million ounces in 2024, making solar responsible for around 17% of total silver demand, according to The Silver Institute. That share has been climbing steadily as solar installations expand globally.
Electric vehicles are another source of growth. EVs require more silver than traditional internal combustion engine vehicles due to their heavier use of electronics and power-management systems. Industry estimates suggest battery-electric vehicles consume roughly 25 to 50 grams of silver per vehicle, or about 67% to 79% more than internal combustion cars.
Then there’s data centers and artificial intelligence. Large-scale data centers rely on dense networks of servers, switches, and cooling systems, all of which use silver in electrical contacts and connectors. High-performance chips such as GPUs and TPUs also incorporate small amounts of silver in internal connections and packaging.
Taken together, this narrative argues that rising industrial use, particularly from solar, EVs, and data centers, is pushing the silver market toward a structural deficit.
Cheap Gold or Speculative Mania?
So both narratives are out there: silver as cheap gold, and silver as a growth metal.
I lean much more toward the first explanation as the main driver of this year’s move. The investment flows into silver have been enormous, and they look strikingly similar to what we saw during previous speculative spikes, including 2011. That framing also better explains what’s happening across the broader precious metals market.
This isn’t just a silver story, or even a silver-and-gold story. Platinum and palladium have surged as well. If this rally were primarily about silver-specific fundamentals, it would be hard to explain why metals with very different demand profiles are all exploding at the same time.
Palladium is almost entirely an industrial metal, with demand heavily concentrated in autocatalysts. Platinum has a more diversified base, spanning jewelry and industrial uses such as chemicals, glass, and refining.
Yet all these precious metals are moving together.
That kind of synchronized move across metals with very different end markets isn’t a coincidence. It’s what speculative episodes in commodities tend to look like.
A Familiar Pattern in Commodities
That doesn’t mean the silver growth story is wrong. It’s a coherent argument, and it may well shape the market over the long run.
We see compelling commodity growth narratives all the time. Oil has had several, including most famously, the “peak oil” story, which argued that supply constraints would drive permanently higher prices.
Lithium went through its own version more recently, fueled by fears that EV adoption would overwhelm global supply. Copper has a similar narrative today, tied to electrification and grid expansion.
These stories are often grounded in real trends. But in commodities, prices rarely move in straight lines. As prices rise, demand gets destroyed or substituted away, supply responds, and the cycle eventually turns.
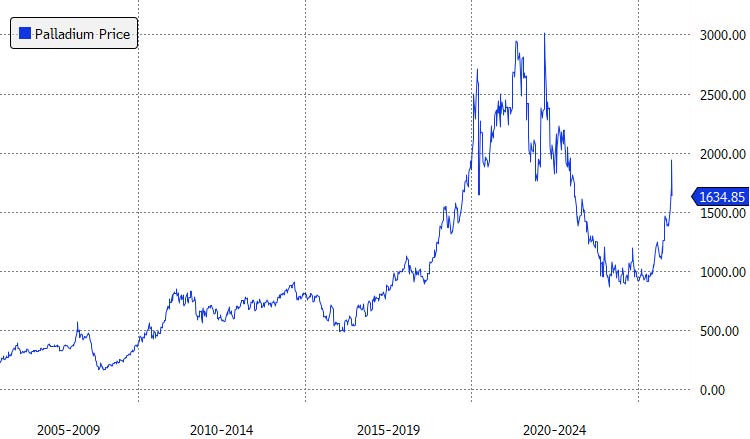
We’ve also seen isolated bull markets within precious metals themselves. For much of the past decade, palladium dramatically outperformed gold as tightening emissions standards boosted demand for autocatalysts.
But eventually, substitution, weaker auto demand, and improving supply ended the squeeze. Palladium is still roughly 50% below its all-time high, despite this year’s rebound.
If you’re investing in silver, or any commodity, primarily on a growth story, it’s worth keeping that history in mind.
Gold Is Different
Gold is the exception. It has increasingly become a portfolio and reserve asset, held by central banks and investors as a diversifier with historically low correlation to the broader economy and financial markets. That’s what makes gold different, and more interesting, than a cyclical commodity riding a demand narrative.
That said, in the near term, all of these metals look extended, gold included. At this point, they’re largely momentum trades.
Some investors believe that momentum will continue. Silver’s breakout above $50 cleared a long-standing ceiling from 1980 and 2011, a move that technical traders see as opening the door to much higher prices.
Others point to the gold–silver ratio, which has fallen into the low 60s and could, in theory, move back toward its 2011 low near 32, implying substantially higher silver prices. Still others argue that silver could revisit its inflation-adjusted 1980 peak north of $200 an ounce.
Maybe that happens, maybe it doesn’t. It’s all highly speculative.
I’m not interested in playing that game. There’s always something going vertical somewhere in the market. Silver doesn’t particularly excite me from a long-term portfolio perspective (maybe that’s apathy from watching too many commodity manias over the years).
Gold, on the other hand, does interest me as a portfolio diversifier. But especially after its recent run, it’s something that requires a longer time horizon, and not a bet on what it’s doing this month or this year.
Very well written